Prevalence, FP, TP and Biased FP:TP When Prevalence is Low
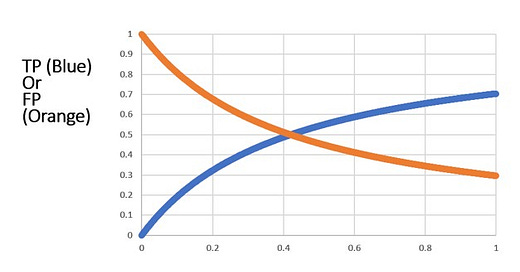
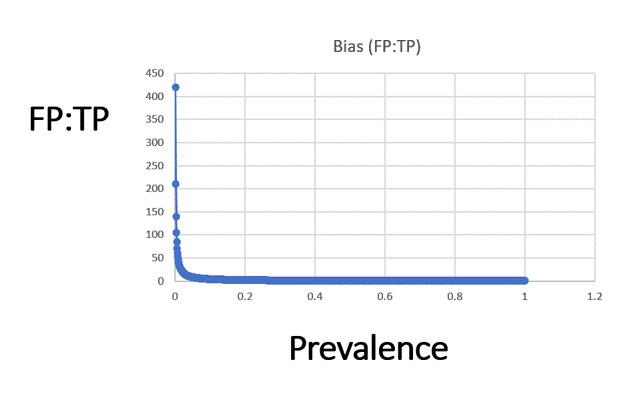
Here are the charts showing that, out of mathematical necessity, the false positive is very high FP>>TP when prevalence is low
When CDC launched and FDA approved of PCR testing with no way to estimate the baseline cycle threshold (Ct; for every patient, every time), they set us up for a future with unacceptably high false discovery rates.
In my “most important” article, I goofed in my calculation in way that led to 80:1 FP:TP bias when prevalence was at 5%. The minute it was pointed out (BenBongo), I fixed the problem and updated the article:
The relatively trivial error actually opens up the opportunity to underscore the issue revealed by Dr. Lee’s study quite well and teach more about the problem of high FPs with low prevalence.
At any false discovery rate that is not close to zero, at low prevalence mass testing will be a disaster because false positives will greatly outnumber true positives.
Obviously, the higher the false discovery rate at a given prevalence, the worse the problem will be.
So, some definitions:
TP = people w/the condition you’re diagnosing who test positive (let’s assume the test detects all of them for our purposes.
FP = people w/out the virus who test positive.
Total # of test positives = TP+FP
TPR = True positive rate = TP/(TP+FP)
FDR = False discovery rate = FP/(TP+FP)
Effect of Prevalence (the % of people w/the condition you’re diagnosing)
When prevalence is varied, then we can see that FP»TP initially. Remember, the test in this scenario is detecting all of the people with the condition.
The bias in FP:TP is
I chose 5% arbitrarily; I could have chose any; the bias is 80:1 at 0.05%, and it’s about 17:1 at 2.5%; at 4% it’s 10%.
This is true for any diagnostic that has a false discovery rate of 42%: the FP » TP when the prevalence is low.
And this is why Dr. Lee’s study underscore the point: the FP:TP bias has varied since 2020 to today with the prevalence of the actual infection rate, and the trials conducted used a test on populations that had very low prevalence. Thus, the outcomes of the trials in terms of number of cases in the vaccinated groups and number of cases in the unvaccinated groups are bogus.
This truth is fundamental.
So, what rate applies in COVID-19 depends on the prevalence.
The Marines study had at 37% FDR, but the investigators glossed over that.
And this is a separate issue that the biases induced by not counting people as vaccinated until 5 weeks after the first jab, and separate from the bias induced via the drop in the Ct threshold just for the vaccinated (by CDC for reporting).
In fact, CDC was using this well-known problem to their advantage to make the vaccine appear more effective than it was.
I hope this clarifies this particular point: the results of Dr. Lee’s study do not hinge and do not depend on my simple math example at all.
Thank you BongoBen for finding the error in my toy math example.


No, the Marines study does not have a 37% FDR. It said that '95% complete viral genomes' were not obtained from 37% - not the same thing.
But this does introduce an interesting question - how do you define a 'positive'? How complete a viral genome is needed to determine the sample to be a 'true positive'? Do you need 95% or is 80% enough?
But, if we accept your assumption, and that the 37% FDR is true for the initial testing of all 1847 participants, this study would indicate that the maximum FPR is 0.33% - that out of every 1000 negative samples, less than 3.3 would return a positive result. We have little to worry that false positives will not significantly increase the positive detection rate. Even at a positive detection rate of 3%, true positives will outweigh false positives by 10:1.
Thanks. Learned a lot!